Mathemathinking of Intelligent Reflective Surfaces
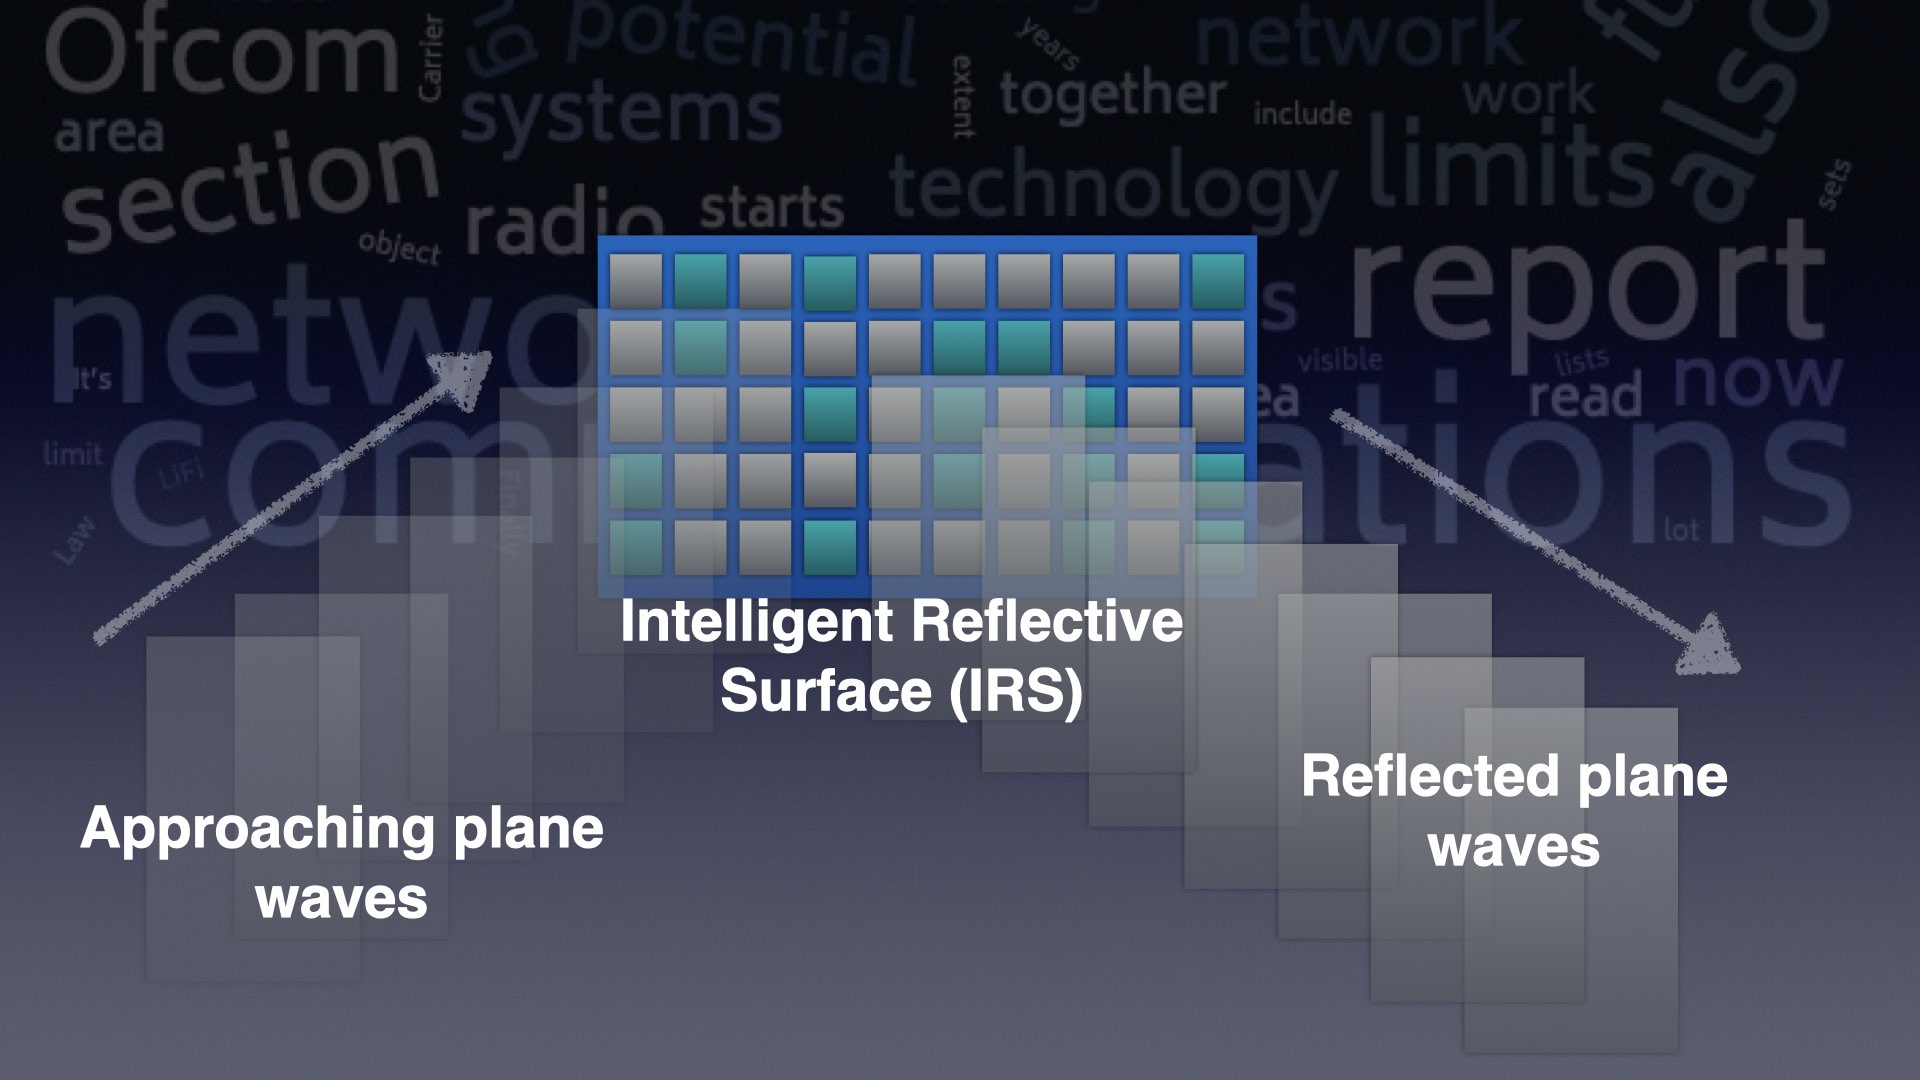
In the Signal Processing Cup 2021 competition, one of the key findings of our team was figuring out the sparsity in the communication channel that involved an Intelligent Reflective Surface (IRS). In the competition a hint to use the word ‘sparsity’ was strongly mentioned by the organizers, but which kind of sparsity or how to utilize this was not clearly mentioned. Probably, the organizers expected the competitors to figure them out.
First of all I need to thank our supervisor Dr. Prathapasinghe Dharmawansa and my fellow team members Amashi Niwarthana , Kithmini Herath, Pamuditha Somarathne, Ramith Hettiarachchi, Tharindu Samarakoon, Tharindu Wickremasinghe and Thieshanthan Arulmolivarman, because concepts and diagrams provided in this article are available due to our combined work and continuous feedback cycles among us. And also I need to thank Dr. Chathuranga Weeraddana for the advice that resulted in better concepts and diagrams.
In the SP Cup competition, we were allowed to use three pages for our final report. In the final round we could not use more than few slides and ten minutes to speak. So much of the mathematical background behind our work was left undocumented. This article will serve the purpose of documenting the undocumented.
The simple yet elegant linear model
Before moving on to explaining the exploited sparsity, I’m explaining the major formula that we came up using the simple linear model.

Above formula fits the standard Multi Variate Multiple regression model. This type of formula was provided in the recommended papers provided by the competition organizers. And it explicitly mentioned the use of Linear Model in the problem. This formula addresses the channel estimation for IRS assisted OFDM communication in static environments. It addresses the number of sub-carriers and channel taps that model multi-path fading.
According to the problem statement, two datasets are provided to the competitors. To sum up, there are fixed IRS configurations and associated received signals. Transmitted signal is a constant value that is repeated all the time.
To sum up simply, there are received symbols and associated IRS configurations. IRS is a very simple one in this competition. It can only manipulate the phase, but not the amplitude of the signals. Each element has two states. In one state it does nothing, in the other state it adds 180 degrees to the phase. Actual situation is more complex, but above simple rules are sufficient to address the whole problem.
This is repeated over 51 users. So the model should be used for 51 users repeatedly. Data set 1 contained only the information about user 1. Dataset 2 contained limited information about the rest of the 50 users.
Estimation target and the symbols
The use of linear model in this problem needs no explanation. What need explanation are the estimation target and the symbols used here.
Our estimation target is denoted by ‘B’. It contains two symbols ‘V’ and ‘hd’. V is the channel that goes through the IRS. ‘hd’ represents all the channel taps that are not affected by the IRS. Estimating both of these channels results in a complete explanation of what happens to the transmitted symbols. The symbol ‘X’ denotes the hadamard matrix that contain different IRS configurations. Terms in the left and right could calculated by performing multiplication among known matrices and scalars.
So ‘B’ could be easily estimated using the well known formula below,

A deep dive into ‘V’
In dataset 1, there are 16384 IRS configuration - received signal pairs for channel estimation. And In dataset 2, there are 4096 pairs for each user.
Since there are 4096 meta elements in the Intelligent Reflective Surface, one can expect 4096 channels through the IRS. And also we assume that these 4096 channels are independent of each other. This makes the model simple and easy to understand. In addition there is ‘hd’ and the total channels become 4097. Each channel has 20 taps. The shape of ‘V’ would be 4096 X 20 and shape of ‘hd’ would be 1 X 20. With ‘V’ and ‘hd’ stacked together, the shape of the stack becomes 4097 X 20.
In dataset 1, estimating 4097 channels from 16384 data points is straight forward. In dataset 2, estimating 4097 channels from 4096 data points is impossible. When we tried, it resulted in one channel being missing or duplicated. The plan was to make as many as inferences from dataset 1 to find clues or hints to crack this problem.
The first step was having a deep dive into ‘V’. The organizers were trying to give out their hints to all the participants, so that the participants went in the right direction. The first hint was available in the Webinar 1 YouTube video. The below video will automatically start from the hint we are concerned about.
Most important diagram is given below. It describes a spatial model for IRS channel when the communication is narrowband, which means approximately the frequency of the electromagnetic waves hitting the IRS is constant. In this problem what we are dealing with is OFDM communication, where several channel taps are assumed to exist. The answer is a single channel tap in OFDM communication can be assumed to be a narrowband channel.
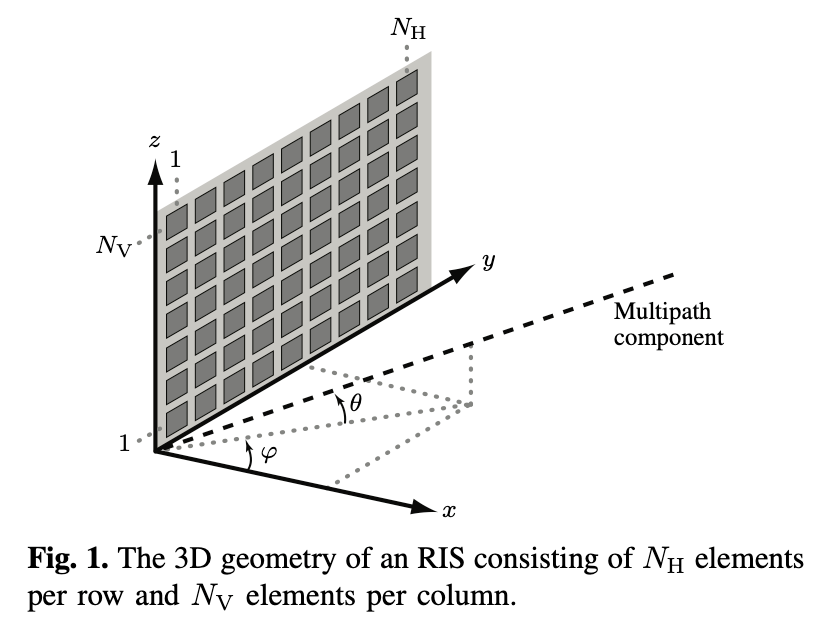
This image was taken from E. Björnson’s and L. Sanguinetti’s “Rayleigh Fading Modeling and Channel Hardening for Reconfigurable Intelligent Surfaces,” in IEEE Wireless Communications Letters. After reading through the model explanation of this paper, a very convenient model to mathematically describe the behaviour of the IRS using the geometry of the IRS can be seen.
From the webinar 1, the hint is to make use of spatial sparsity. Now if there is any sparsity existing in the datasets, it can be uncovered by applying this model and looking for any surprises!
Applying the narrowband model
Let’s slowly apply the model described in the paper to a basic general rectangular shaped IRS. Have a look at the System Model and the Rayleigh Fading Modeling sub-sections of this paper for better understanding.
Here we are using a theory called Array Response Vector. I’m directly quoting formulae from the paper in a sequential and an easy-to-understand order.

These two formulae holds the key to everything! The formula in the right is a wavenumber vector. It is a special vector that can be applied in electromagnetic waves. The formula in the left is a column matrix full of exponential functions. The column represents the building blocks of narrowband channels through each IRS element. In our model a single channel tap of ‘V’ will include 4096 values similar to this column vector, because of the following formula.

where,

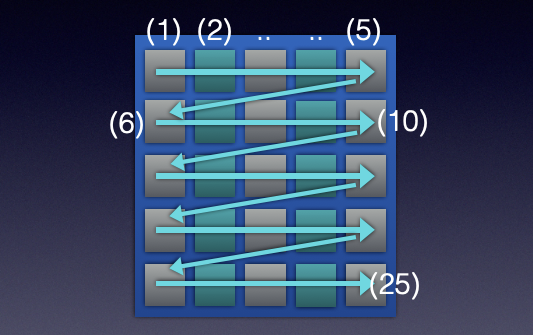
‘Un’ is a general expression to obtain the position vector of each IRS element. When n is incremented the element we are considering changes in the following direction. Since the IRS is in YZ plane. ‘Un’ does not have an X component. Only Y and Z components depend on horizontal and vertical lengths along with functions that depend on n. Since we have a definite order as below, we can find i(n) = mod(n-1,number of horizontal elements) and j(n) = floor((n-1)/number of horizontal elements) quite easily. The image below shows a 5X5 IRS for simplicity. But we are actually considering a 64X64 IRS in the problem.
A little trip back to electromagnetics
Let’s try to understand the wavenumber in the well known wave equations. The easiest way to understand is using a basic One dimension wave travelling in a certain direction.
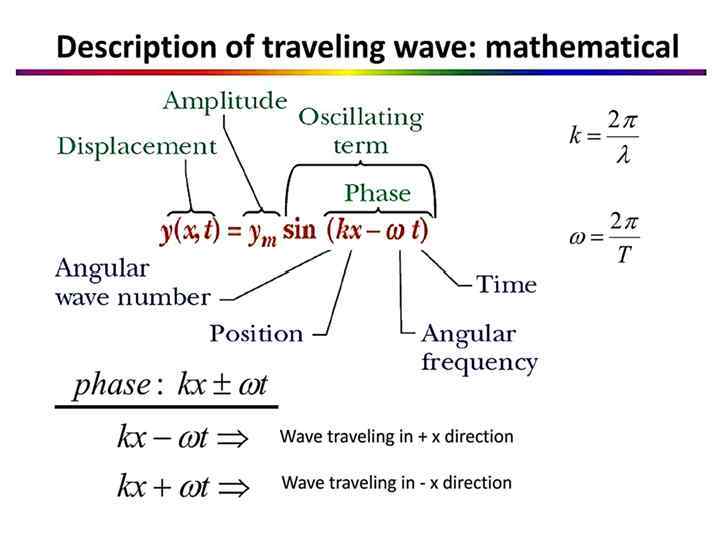
The amplitude of a 1D wave should be modelled using a space dimension (x) as well as time dimension (t). A wave always has a frequency in time. We usually use simple greek letter Omega for that. It is very well used because, in electromagnetic waves we have a spectrum ranging from radio waves to gamma waves. We rarely think of a wave’s frequency in the space dimension. The wavenumber k comes in here. The wave number is proportional to the reciprocal of wavelength. A small wavelength means the frequency of a wave in the space dimension is high. It makes sense right?
Try to draw a wave in the space dimension. A simple sine function would be enough. If the sine function is compressed in the direction of x, then the frequency of this wave is high in this dimension. I think, it makes sense better when we think of waves that way. So now, how do we integrate both ‘time frequency’ and ‘spatial frequency’ together to form a closed form formula to describe a 1D wave? It is given below.
Electromagnetics waves are not 1D, they are moving in the 3D space. Now we need to extend this model to 3D space. This will result in the spatial frequency becoming a vector, giving rise to wavenumber vector. The magnitude of this vector is simply the wave number of a 1D wave. Electromagnetic waves travel in a certain direction. It has planes that have similar phase at a given point of time. These planes get together to form electromagnetic plane waves. The direction of the wavenumber vector is perpendicular to these plane waves. That means wavenumber vector points in the direction these plane waves are travelling. To understand this better, I would recommend watching the following lecture by Prof. Walter Lewin. The video will start right at the important place.
What will the dot product of a position vector and a wavenumber vector would mean. The resulting scalar would result in a phase difference between two spatial points. What are these two spatial points? One would be the origin while the other would be the point denoted by the position vector. What is a plane in a plane wave? It is a set of points where the phase of the wave is constant. So, all the points in the plane will have the same dot product.
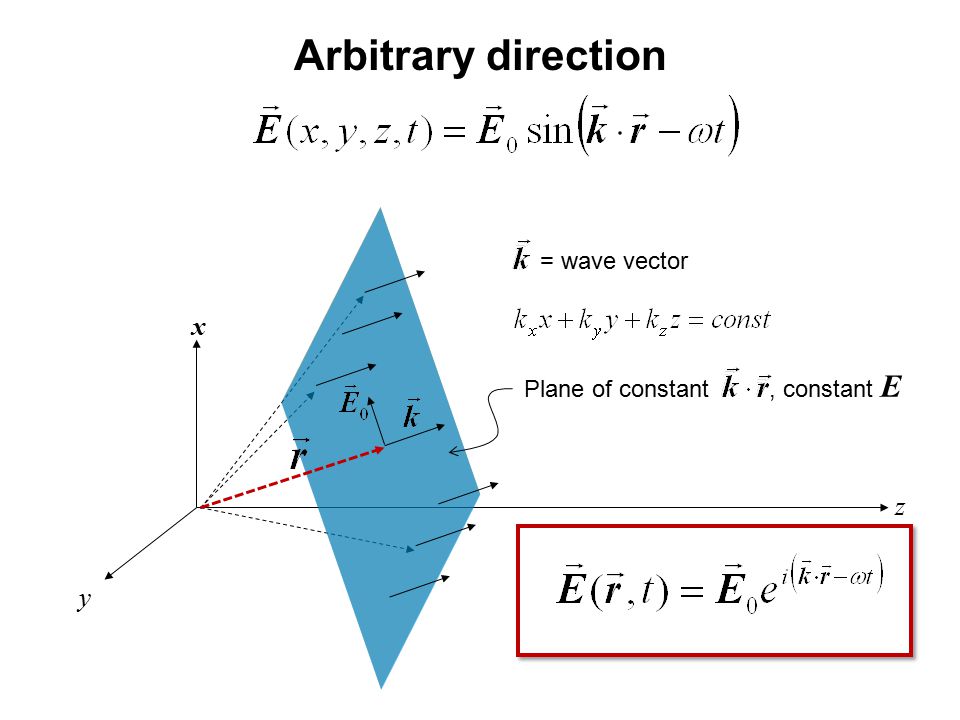
According to the model in the Prof. Emil’s paper, the narrowband channel of the waves impinging on the IRS, can be modelled using this phase and an amplitude constant. I’m repeating the same formula that I mentioned earlier. In the left side we can see they have taken the dot product of position vectors of IRS elements and the wavenumber vector. This means that this column will contain complex numbers with phase that is equal to individual phases of the electromagnetic wave at IRS elements with respect to the origin.

Then we will add a constant to include an arbitrary amplitude to the phases and we consider multiple waves arriving from different directions. This will result in the following formula for the impinging channel.

The same should go for the channel that denote electromagnetic waves that are going out of the IRS. But, what about the IRS itself. We know that there is a 180 degree phase addition in the problem. The model also includes a simple formula to include the phase manipulation performed by each IRS elements.

Heading towards a closed form formula
Let’s use all these formulae given to derive a formula for one channel tap of size 4096X1. Let’s consider a plane wave impinging on the IRS from a single direction and then reflected to another direction. If we do not consider the phase addition by the IRS for now, the first element of the channel tap column will be as below,

Let’s assume l and m to index the IRS elements using (l,m) coordinate system. Here, l denotes the horizontal index while, m denotes the vertical index. (1,1) element denotes the top left corner, while (64,1) bottom left corner. (64,64) denotes bottom right corner. ‘Nv’ denotes the number of rows in the IRS. ‘b’ is the size of the assumed square shaped IRS element. The value of a general element in this column matrix will be equal to,
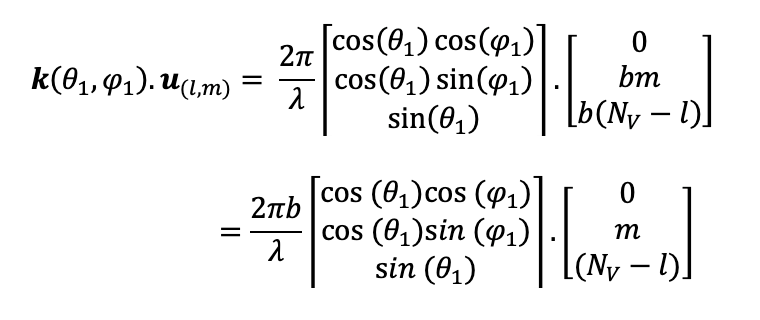
For simplicity of explaining, let’s take a part and expand it,

It leads to a complex but a closed form formula with sines and cosines. Now let’s see what we can identify from this closed form formula. This is a discrete function of both l and m. We have seen discrete signals with cosines and sines. According to this, some kind of repetition with phase shift is expected because of the nature of the formula. Let’s make theta equal to 0 and then see what happens,
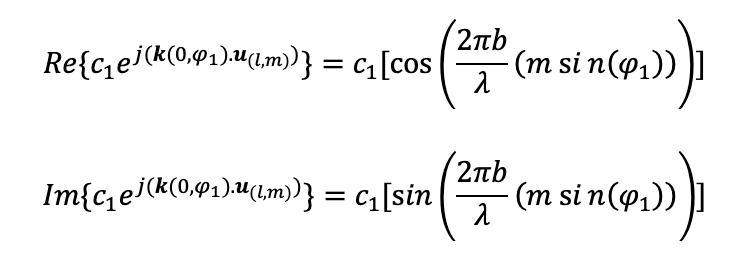
The formulae are periodic functions. Please refer to the earlier diagram to recall what theta is. This is the elevation angle. When we searched for any pattern in ‘V’ in the dataset 1, we instantly identified the periodicity by 64. We came to two conclusions from this.
1) The width of the IRS is of 64 elements, which means the height will also end up becoming 64.
2) The elevation angle is zero, which means base station, IRS and all the users are in a single horizontal plane.
Tweaking the linear model to enforce periodicity
Now we have identified the periodicity. So what now? Where is the sparsity? Sparsity is inside the periodicity. Since the columns are periodic by 64. If we know first 64 elements, then we already know 4096 values in each column. We need a way to directly estimate this 64X20 matrix using all the data values. In earlier method, we would be estimating 4097 channels with 16384 data points. We observe periodicity, but we do not enforce it. If we enforce it, the estimation will be highly accurate compared to earlier version because, we will be estimating 64 channels using 16384 data points.
We have solved the problem of sparsity, because now we can estimate 64 channels using 4096 data points per user. The goal is to make use of the same elegant and simple Linear Model for this as well. This required tweaking the matrices in the first estimation formula I have mentioned on top of the article. Watch our presentation below to see the tweaking of matrices. It will start at the right place.
This matrix tweaking was beneficial in three ways,
1) The estimation of channels became very fast compared to the earlier version.
2) NLOS users, whose SNR was very low channel estimation suffered a lot from noise. This method increased the accuracy of the channel of these NLOS users.
3) IRS configuration search using heuristics became better and faster, leading to better data-rates.
The rest of the work was on applying the best optimization methods to obtain IRS configurations to maximize data-rates. I have only gone deep into the channel estimation part. I think optimization part will require another article as long as this. I would be pleased to clarify any problem regarding channel estimation, if you mention them in the comment section below.